Virtual Database Access to Delimited Files (CSV/TSV) Stored Remotely

Delimited files are commonly used when importing and exporting data with relational databases and other data stores. As cloud storage services like Google Drive, Box.com, Amazon S3, and more evolve, enterprises are increasingly using them as repositories for data that has already been collected, cleansed, and transformed.
Modern BI tools often come with built-in support for flat files, but only those found on premises. With the CData Drivers for CSV, you can point to a remote directory and bind to it like a database, giving you access to live, remote CSV data in the BI tools you already use. Dashboards, charts, and graphs can be updated dynamically, offering a real-time look at the enterprise data stored in the remote directory.
Connecting to CSV Data
The CData Drivers for CSV allow you to connect to on-premises and remote CSV resources. In this post, we will walk through connecting to a Box directory that contains CSV files and visualizing the data in Power BI using the CData ODBC Driver for CSV. While we highlight Box in this article, the driver also connects to the following data sources:
- HTTP/HTTPS streams
- Amazon S3
- Google Drive
- SharePoint
- FTP/FTPS Servers
Configuring the ODBC Driver for CSV
To connect with CSV files stored in Box in Power BI, you will need to install the ODBC Driver and configure a DSN. To bind to a remote directory as a database, set the URI connection property based on the service you are connecting to and the path to the directory. The ODBC Driver uses OAuth to authenticate with Box, so you will need to set connection properties based on values from a new or existing Box application created with a Box developer account. Review the Getting Started -> Connecting to Box section of the Online help for more information.
For this article, we copied sample CRM data as CSV files to a directory in our Box account. Download the sample data and copy it to your own Box (or other remote storage service) account to follow along with the example.
Setting Connection Properties for Box
- URI: Set this to "box://remotePath"
- OAuthVersion: Set this to 2.0
- CallbackURL: Set this to the Redirect URL
- InitiateOAuth: Set this to GETANDREFRESH
- OAuthClientId: Set this to the Client Id
- OAuthClientSecret: Set this to the Client Secret
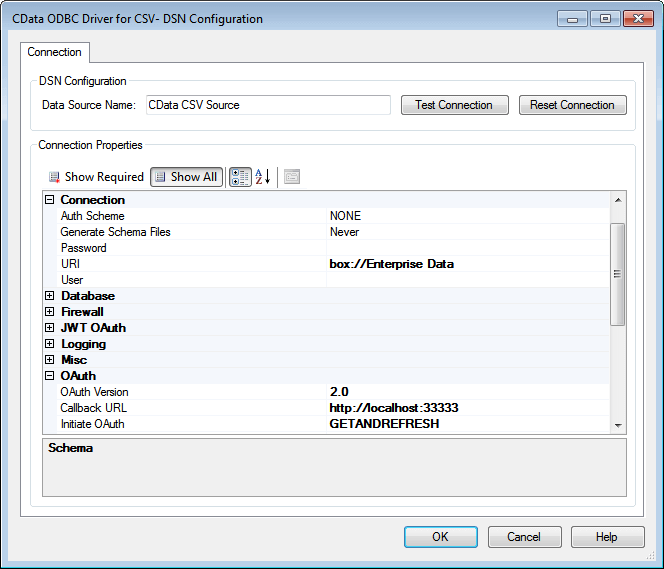
Once the DSN is configured, click Test Connection to trigger the initial OAuth flow, authenticating the driver to connect to a Box account. With the DSN configured and authenticated, we are ready to explore and visualize the data in the CSV files stored in the designated directory in the Box account.
Visualize CSV Data from Box in Power BI
After you create a DSN for the CSV Data in Box, you can connect to the data as an ODBC Data Source in Power BI Desktop.
Connect to the ODBC Data Source
- Open Power BI Desktop, click Get Data -> ODBC.
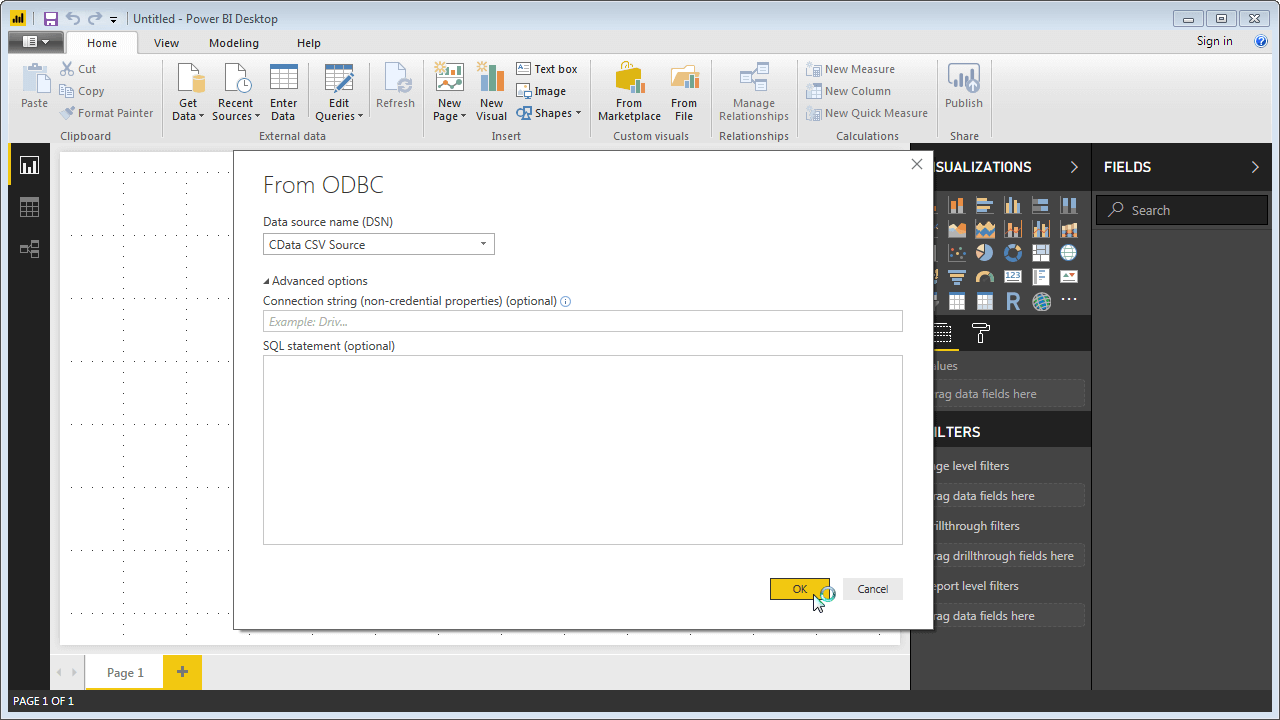
- Select the DSN you previously configured. If you know the SQL query you want to use to access the data, expand the Advanced Options node and enter the query in the SQL Statement box (each CSV file in the directory is treated like a table, with columns and rows).
- Select tables to work with in the Navigator dialog.
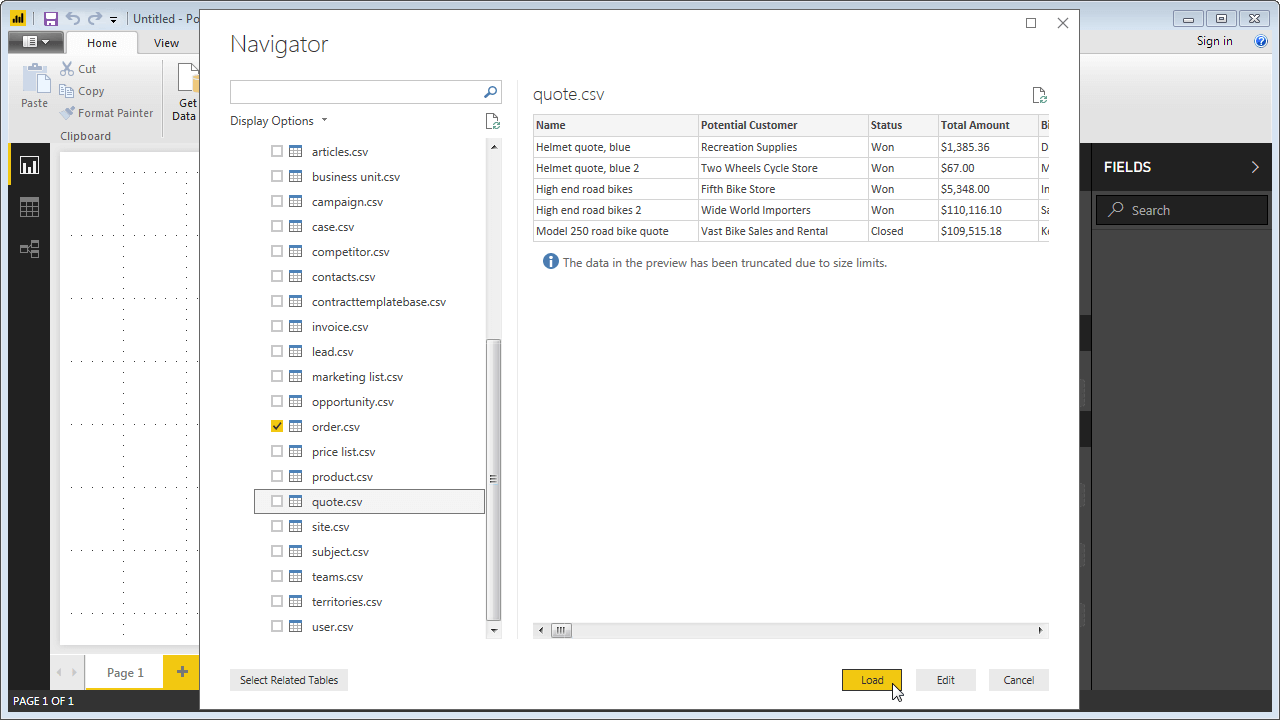
- If you wish to enrich your CSV data with other data sources, pivot CSV columns, and more, you can use the Query Editor. Power BI detects each column's data type through the driver, which uses dynamic metadata querying and intelligent row scanning. Otherwise, click Load to connect to the data in Power BI.
NOTE: You can choose to connect directly to the directory and rely on the metadata querying capabilities of the driver to build a schema based on the data, as above. If you have prior knowledge of the data stored, you can use a custom SQL query to build a specific dataset to meet your needs, relying on the CData SQL Engine to manage the complex query instead of the BI tool. For instance, the following query will produce the same visualization, but the CData Driver will handle the data collection and aggregation and present only the requested information in Power BI.
SELECT [accountscsv].Account_Number, [quotecsv].Potential_Customer, SUM([quotecsv].Total_Amount) AS Total_Amount FROM [quotecsv], [accountscsv] WHERE [accountscsv].Account_Name = [quotecsv].Potential_Customer GROUP BY [accountcsv].Account_Number
Define Relationships in the Data
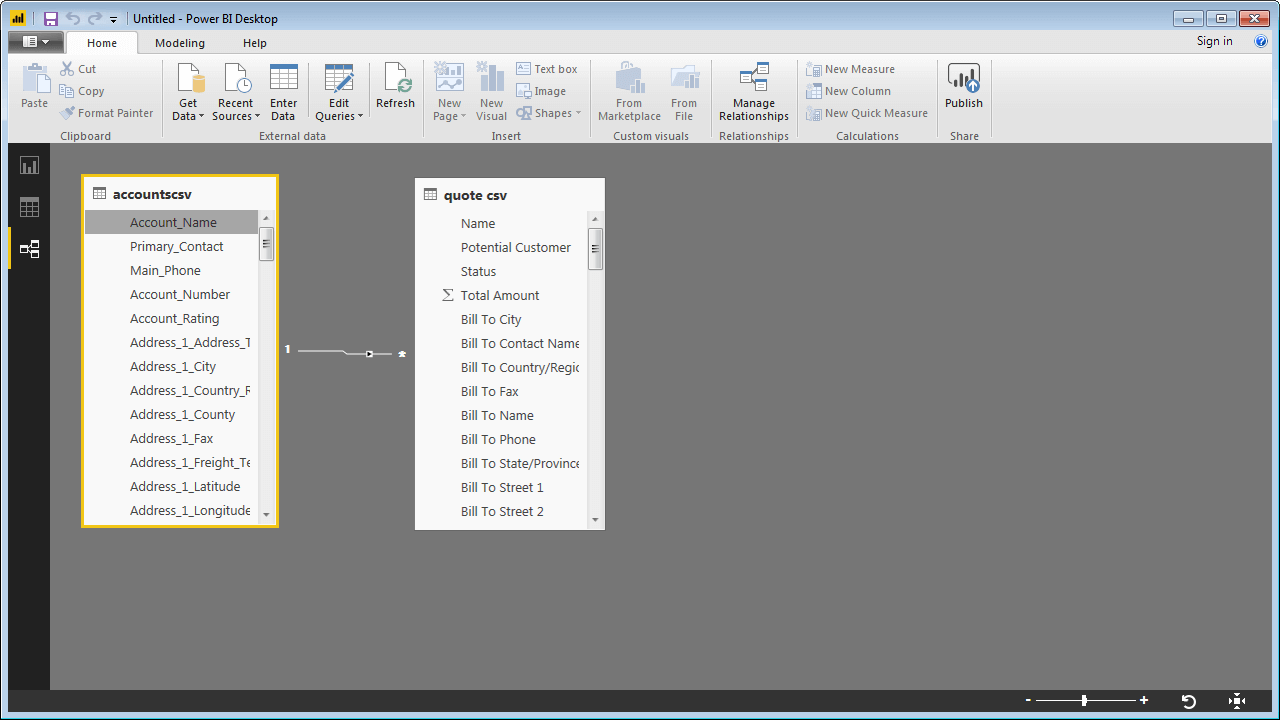
Oftentimes, data will have relationships (parent-child, one-to-many, etc) that can be leveraged to create meaningful visualizations. We can define these relationships in Power BI on the Data view of the dashboard:
Visualize the Data
After you have connected to the data and defined any relationships between tables, you can build visualizations. In this case, we start by pulling the data into a Table, configuring aggregation, and visualizing the data in a Pie chart.
- Select Table as the visualization.
- Choose the [acountcsv.Account_Number], [quotecsv.Potential_Customer], and [quotecsv.Total_Amount] fields as the values for the Table. You should see repeated Account_Number and Potential Customer values. Under the Values, select Total Amount and choose Sum as the summary type.
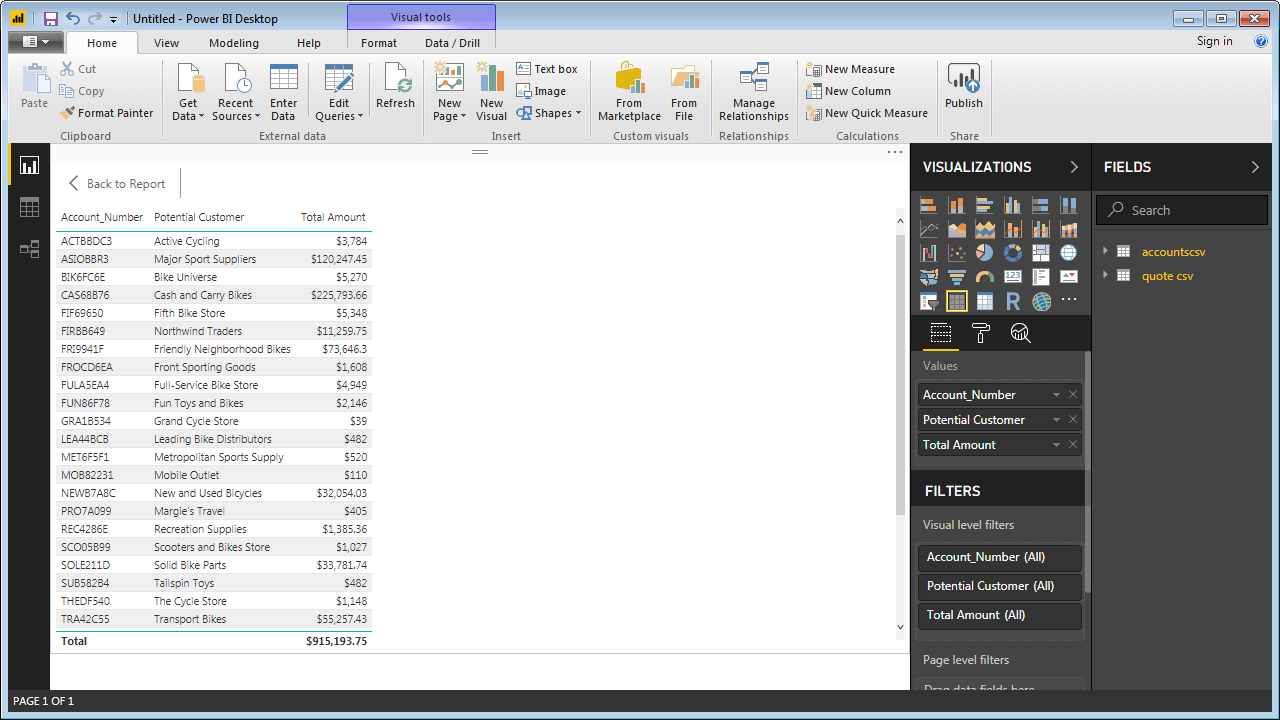
- With the data aggregated, we can choose Pie chart from the Visualizations.
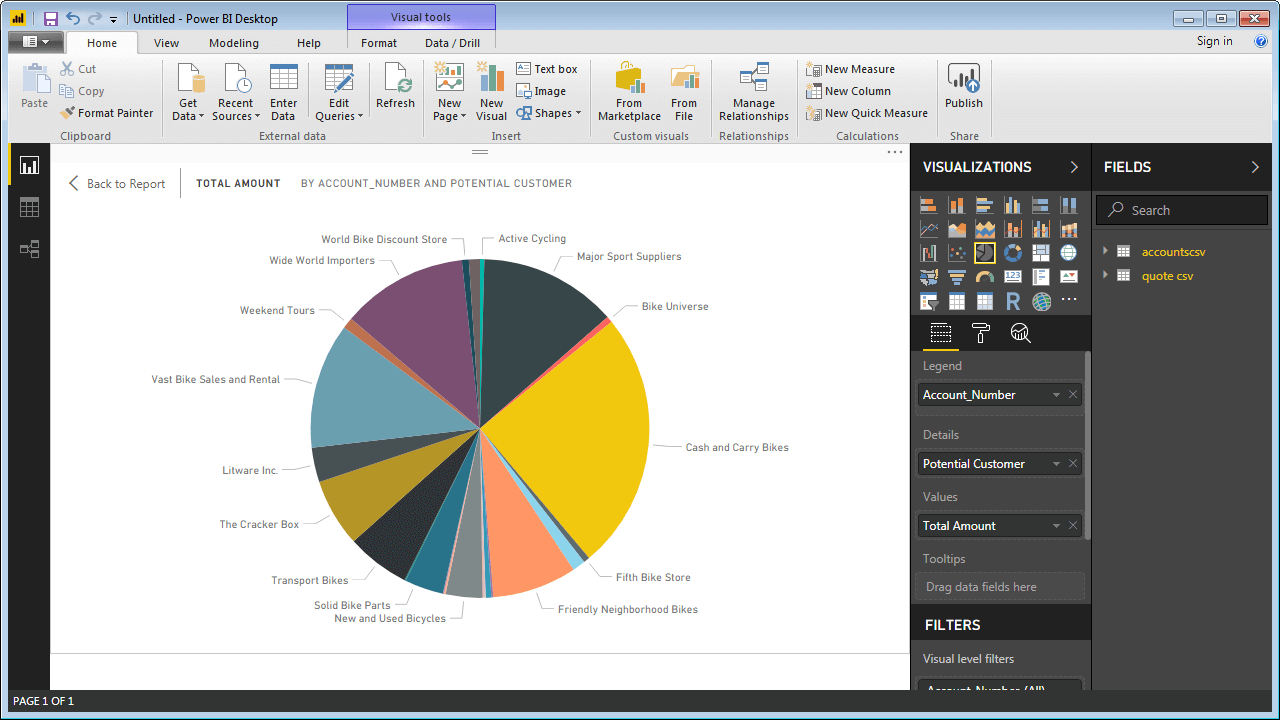
Thanks to the ODBC connection, you can refresh the dashboard and automatically see any updates to the CSV files from services or another user. As more up-to-date data is saved, the visualization continues to give you an accurate picture of real-time data.
Free Trial & More Information
Thanks to the CData Drivers, users can connect BI and reporting tools and custom applications to remote CSV data to drive business. Get started with a free, 30-day trial of a CSV driver. As always, let us know if you have any questions during your evaluation. Our world class Support Team is always available to help.


