Discover how a bimodal integration strategy can address the major data management challenges facing your organization today.
Get the Report →Tableau Connector Getting Started Guide
The CData Tableau Connector provides self-service integration with Tableau, linking your Tableau reports to real-time data. That way, you can monitor enterprise data through dashboards and ensure that your analysis reflects your data in real-time by scheduling refreshes or refreshing on demand. This article explains how to install the CData Tableau Connector, configure a connection to data, and visualize that data in Tableau.
It is important to note that although this article references the NetSuite Tableau Connector, the same principles herein can be applied to any of the 250+ data sources that we support.
Download and Install the Tableau Connector
First, download and install the Tableau Connector from the CData website: https://www.cdata.com/drivers/netsuite/download/tableau/
Fill in the appropriate contact information.

Note: If you are downloading a licensed installer, use your company email address and product key.
Install Tableau Desktop
Now, download and install Tableau Desktop: https://www.tableau.com/products/desktop/download/
Import Data and Create a Data Visualization in Tableau Desktop
After installing Tableau Desktop, follow the steps below in order to pull data from our NetSuite connection:
-
Open Tableau Desktop and click Netsuite by CData under the To A Server heading
![]()
-
On the subsequent form, fill in the necessary properties to connect to your NetSuite instance.
![]()
-
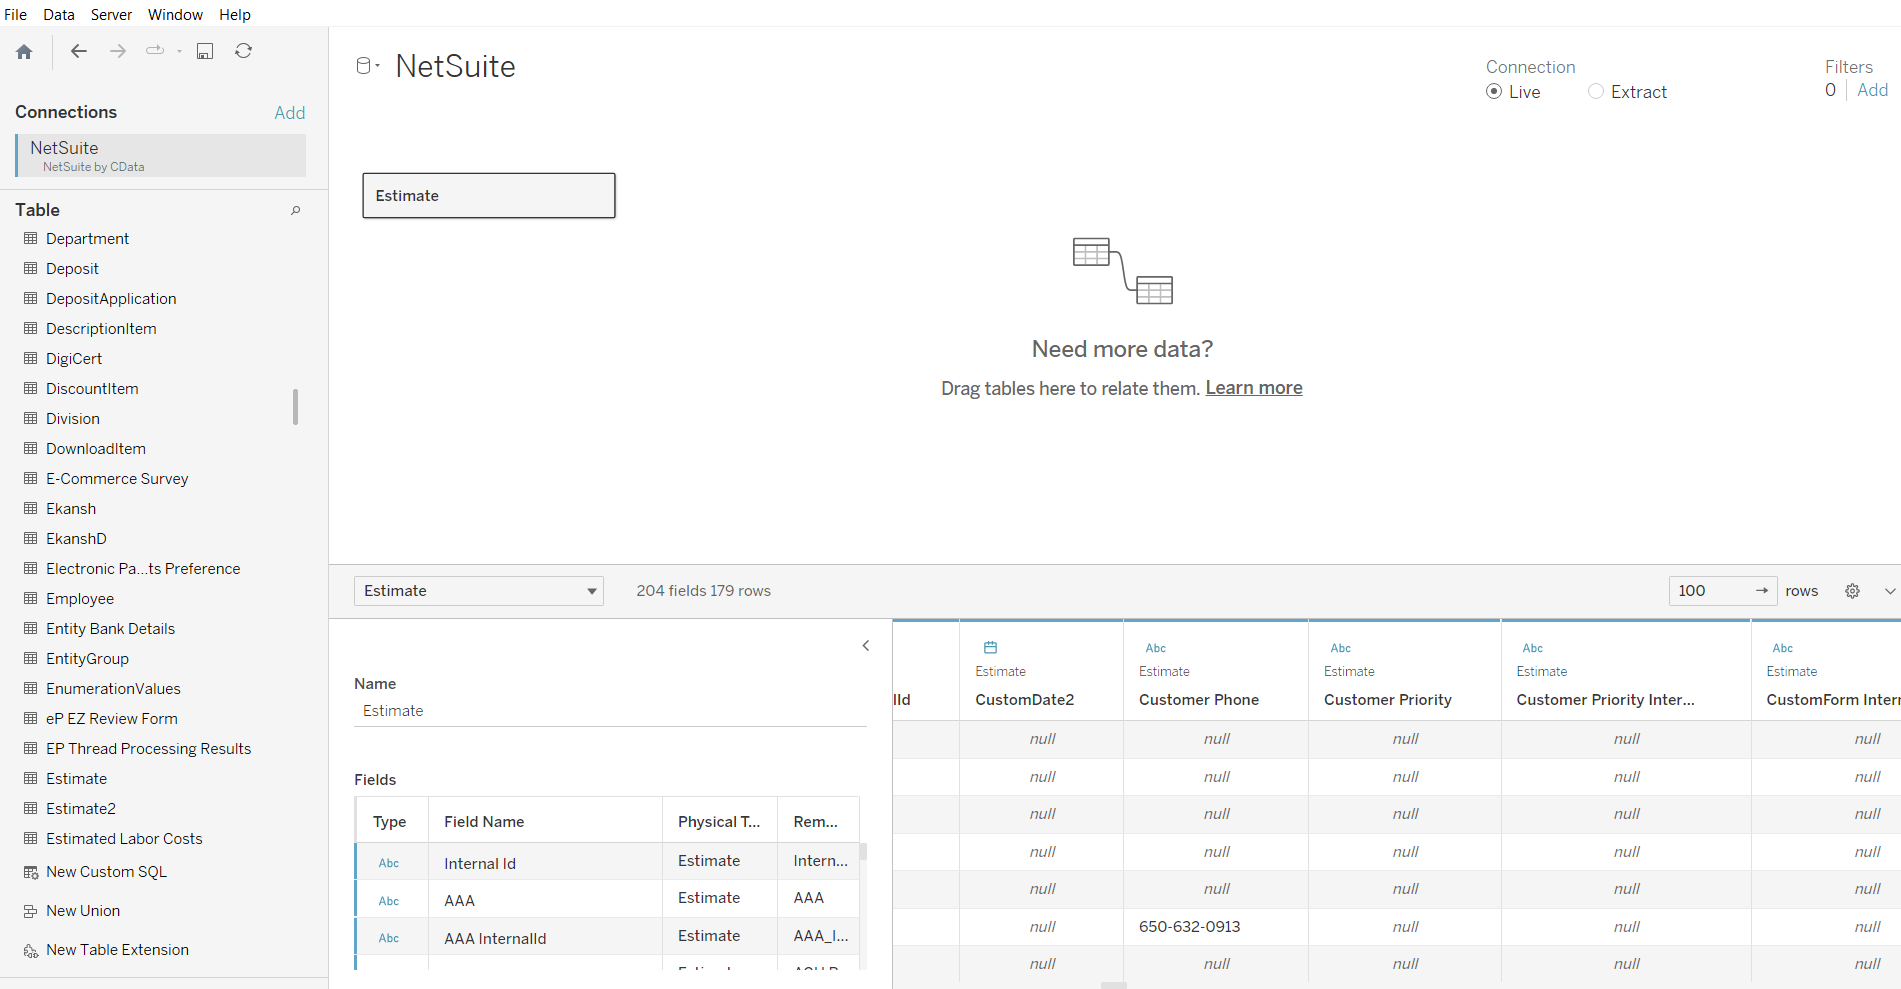
After clicking Sign In, you should now see a blank canvas with NetSuite tables on the left panel.
![]()
-
Then, drag one of the tables from the left panel into the center canvas
![]()
-
Next, at the bottom of the screen, click the small New Worksheet icon. The new sheet
should show the fields from the table that you previously dragged to the center.
![]()
-
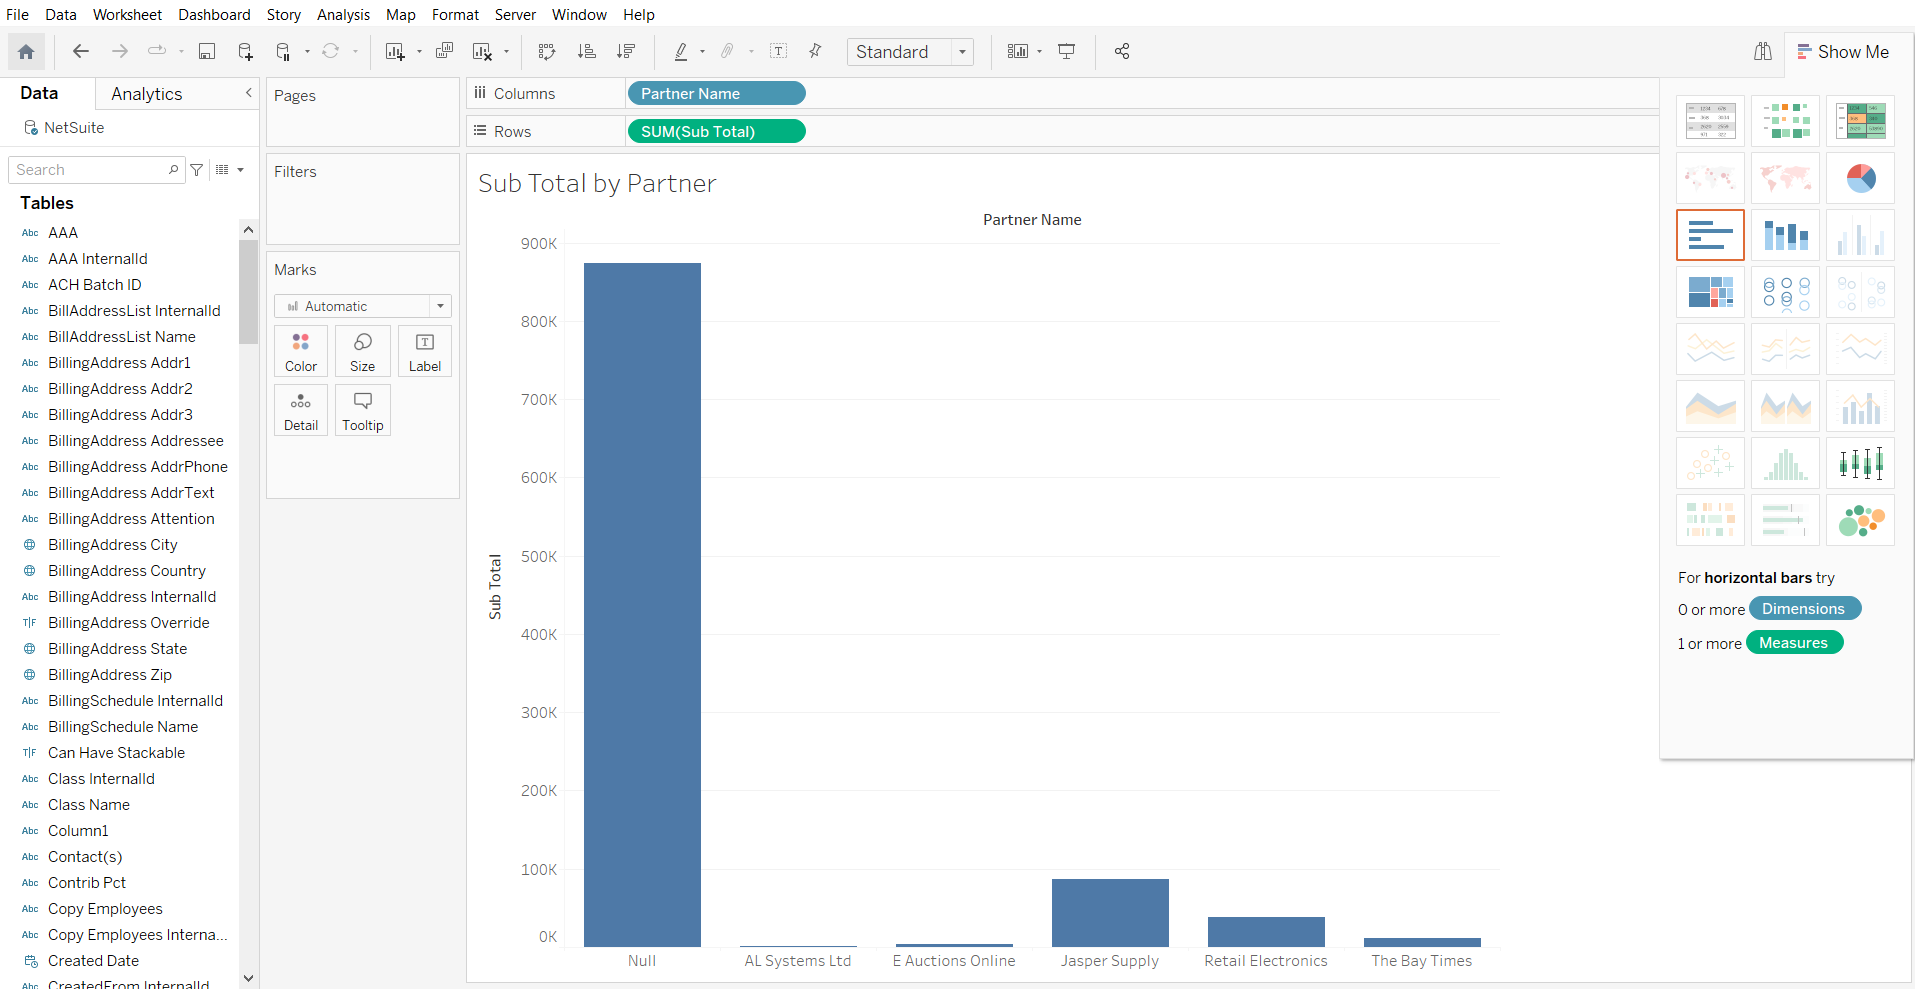
Drag two fields to the top sections of the screen, a measure to the row section and a dimension to the column section. When you drag a measure into the row section, Tableau applies an aggregation to that measure by default.
![]()
You have now created a visualization of your NetSuite data in Tableau using a CData connector!
CData Connectors for 250+ Data Sources
For more information on CData's suite of connectors, visit our Tableau Connector page.
Download a free 30-day trial of the CData Tableau Connector and get simplified access to your data today.


