Too Much Data in Your Warehouse for Power BI – Now What?
As more organizations lean into data-driven digital transformation efforts, lines of business are increasingly demanding access to their data to gain actionable insights into performance and business health. In previous articles, we've discussed how consolidating your disparate data into a single data store can help fight data fragmentation and democratize data access.
But building reports on exceptionally large datasets within your warehouse or database gets complicated when you don't have the right connectivity tools. If you have a single dataset measuring 10s to 100s of Gigabytes, using the traditional data import options available in BI and analytics tools no longer works. You may not have the time or resources to import all of your data before you start reporting.
In this article, we discuss the critical capabilities of the CData Connectors that make real-time analytics and reporting on large data sets possible. We will use the CData Power BI Connector for Google BigQuery in our examples, although the same features are essential for integration with any data warehouse.
Using Real-Time Queries
The majority of BI and analytics platforms have options for querying live data from a data source instead of importing data into the local environment. Live queries offer several benefits, allowing you to:
- Build reports, charts, and dashboards over very large datasets, where it would be impractical (or impossible) to import the data first.
- Reflect underlying changes in the data in near real-time. Re-importing data to collect new information requires more time and local resources.
- Bypass platform-specific dataset caps. For example, in Power BI, you can import 1 GB at most into a dataset.
CData Drivers support real-time access to data, regardless of the tool, platform, or application. Specifically, CData Power BI Connectors support DirectQuery, regardless of the data source.
DirectQuery for Google BigQuery in Power BI
Google BigQuery is "a serverless, cost-effective and multicloud data warehouse designed to help you turn big data into valuable business insights." With built-in support for Power BI's real-time querying technology DirectQuery, the CData Power BI Connector enables live access to your BigQuery data directly in your Power BI reports, charts, and dashboards.
Because of Power BI's dataset cap of 1GB and the local resources required to import and process data, DirectQuery is the only option when working with large datasets. In this article, we use the New York City Taxi & Limousine Commission (nyc-tlc) dataset, looking specifically at the trips for yellow taxis.
You can see the details of the table queried below:
Trips Table Details
Table ID: nyc-tlc:yellow.trips
Table size: 139.29 GB
Number of rows: 1,108,779,463
As you can see, this table contains over 1 billion rows of data, which greatly exceeds the 1 GB import limitation in Power BI. Importing the entire dataset for analytics is impossible in Power BI and would be costly both in terms of time and local resource usage in any other tool or platform.
To connect to the data, we copied the table (and dataset) to a local project and configured the CData Power BI Connector accordingly:
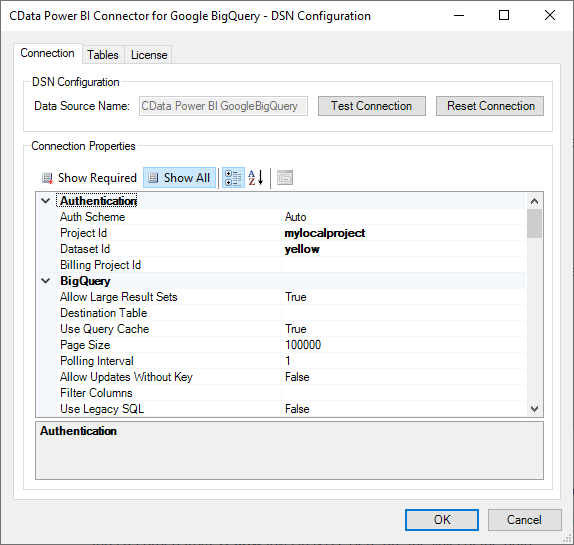
We authenticated with Big Query through OAuth (logging in with our Google credentials in a browser) and were then able to connect directly from Power BI.
Building Visualizations
Building visualizations over large datasets is possible when querying live data because many of the filters, aggregations, and other complexities are passed along to the underlying data source. Passing complex queries down to the data source leverages server-side computational capabilities, speeds up reporting, and frees up client-side resources. With live queries, we're able to build several connected visualizations that update in real-time based on filter changes, drilldowns, and more.
Trips by Vendor
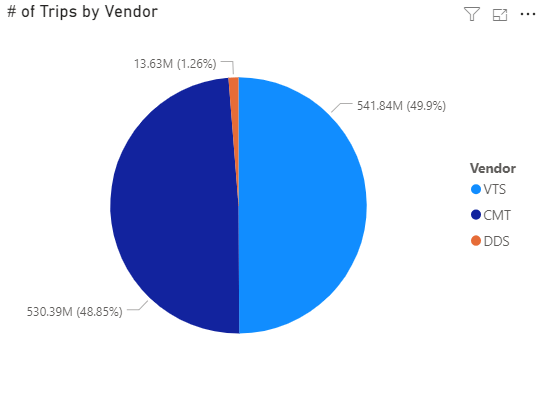
Our first visualization is a pie chart, counting the number of trips by each vendor in the dataset. If we were importing the data, all 1 billion+ trips would need to be imported, grouped, and counted on the client side. Instead, thanks to DirectQuery, Power BI asks Google BigQuery to perform the grouping and counting. With this query, Power BI is now only responsible for building a visualization from 3 rows of data (1 row per vendor), instead of over 1 billion rows.
Average Total Cost by Number of Passengers and Vendor
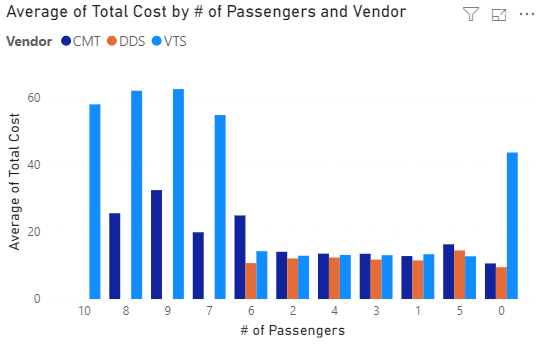
Our next visualization calculates the average total cost of each trip, grouped by the number of passengers and the vendor. For additional complexity, we filtered only those trips with 0 to 10 passengers. Again, instead of requiring local resources to manage 1 billion rows, Power BI asks BigQuery to perform the averaging, grouping, filtering, and ordering. With all of the complexities involved, Power BI is only responsible for charting 33 rows of data (3 vendors times 11 different numbers of passengers).
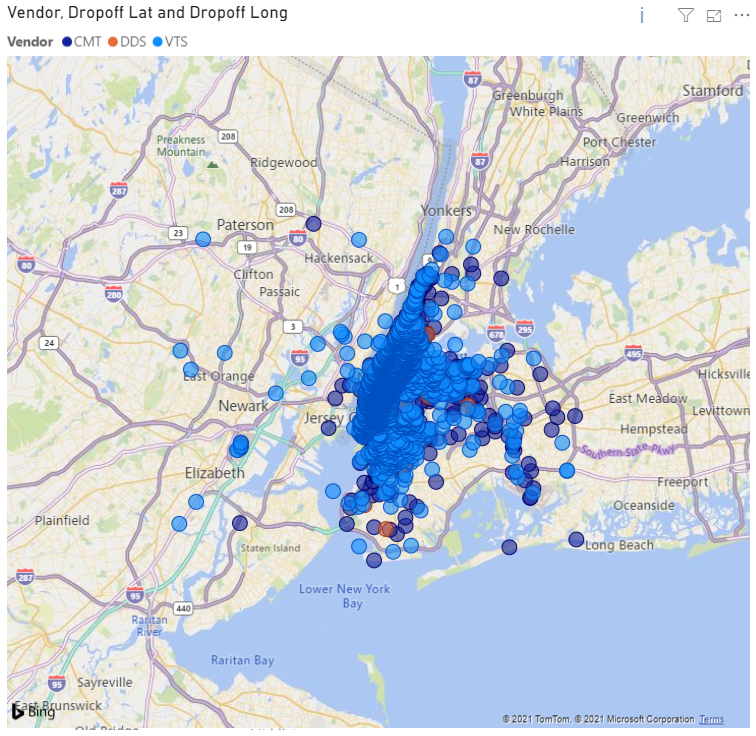
Dropoff by Vendor and Location
Our last visualization displays the drop-off location (by latitude and longitude) for each trip, color-coded by vendor. This visualization uses the least complex query and therefore returns the largest result set.
CData Power BI Connectors
CData Power BI Connectors enable DirectQuery for a wide variety of popular big data storage applications like Google BigQuery. By including DirectQuery support, CData makes real-time reporting possible with any of the visualizations available in Power BI, from pie charts and bar graphs to maps and scatter plots and beyond, regardless of the size of the dataset on the backend.
While this article focused on Google BigQuery, the principals and technology discussed apply to over 250 SaaS, Big Data, and NoSQL data sources supported by CData.
Get Started Today
Download a free, 30-day trial of any of our Power BI Connectors and see the CData difference in your real-time reporting on big data stores today.


