Discover how a bimodal integration strategy can address the major data management challenges facing your organization today.
Get the Report →


Import Google Spreadsheets data into FileMaker Pro
One of the strengths of the CData ODBC driver is its ubiquitous support across many applications. In this article, you will configure the ODBC driver in FileMaker Pro and create data visualizations with Google Spreadsheets data.
Query Google Spreadsheets Data in FileMaker Pro
After creating a new ODBC DSN, you can follow the procedure below to load Google Spreadsheets data into tables in Filemaker Pro.
- If you have not already created an ODBC DSN for Google Spreadsheets, create one with the Microsoft ODBC Data Source Administrator tool. See the "Getting Started" chapter in the help documentation for a guide.
-
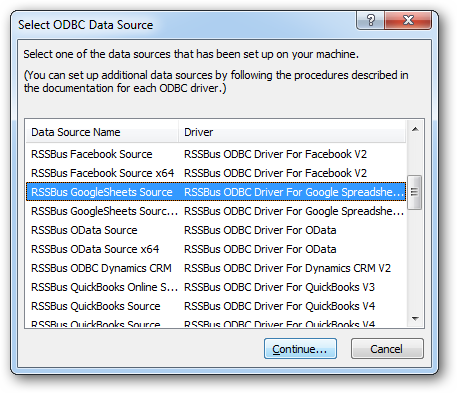
In a new database, click File -> Import Records -> ODBC Data Source, and select the CData Google Spreadsheets (DSN).
![]()
-
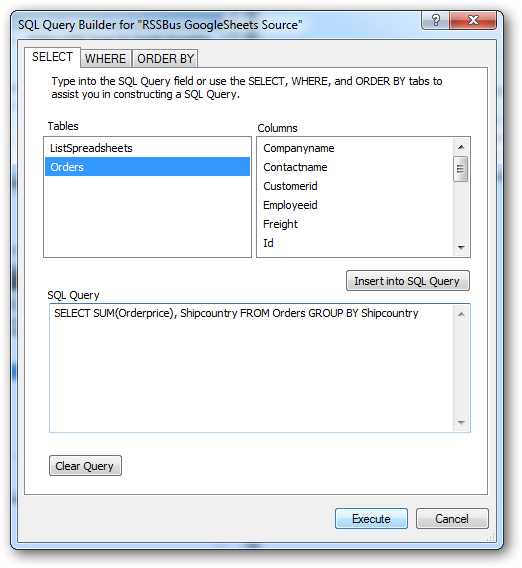
In the resulting SQL Query Builder wizard, select tables and columns and then click Insert into SQL Query. You can edit this query directly. To select all records from a table, enter the query below:
SELECT * FROM Orders
You can use the UI to build filters in the WHERE clause by clicking the WHERE tab.
![]()
-
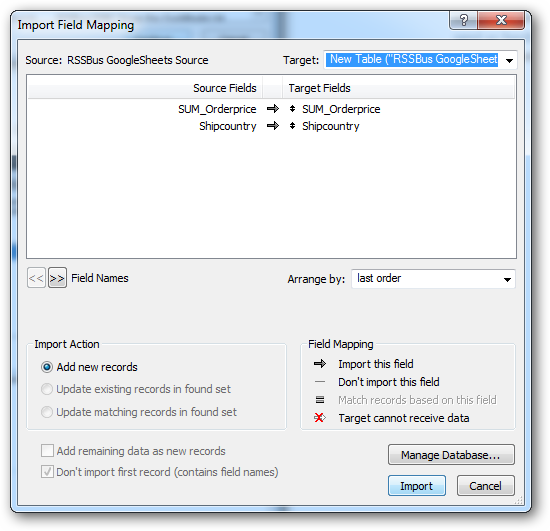
In the resulting Import Field Mapping wizard, you can define mappings from columns in the data source to the columns in a destination table. To create a new table for the query results, select New Table ("CData GoogleSheets Source") from the Target box, and click Import.
![]()
For more information on the SQL that the driver supports out of the box, see the help documentation.
Process Data at Design Time
You can sort and aggregate data, as well as calculate summary functions, while you browse tables. To manipulate the view of data at design time, first complete the two steps below:
- Switch to Browse mode: Click the Mode pop-up menu in the footer of the application.
- Switch to Table view: Click the table icon in the View As menu in the main toolbar of the application.
Aggregate and Summarize
Follow the procedure below to group column values and then display a summary, as shown in the screenshot below:
- Sort: Right-click the Shipcountry column and then click Sort Ascending.
- Group: Right-click the Shipcountry column and then click Add Trailing Group by Shipcountry to group the values and create a subsequent row where summary calculations can be inserted. Click Add Leading Group to introduce the group with a summary.
- Summarize: Right-click a column that has been grouped, and then select a summary from the Trailing Subtotals menu.
The screenshot below displays the number of records in the group, as well as a running count.

Add a Chart to a Report
Follow the procedure below to create a simple bar chart that shows the total OrderPrice for each Shipcountry.
- Right-click OrderPrice and click "Chart by OrderPrice". If you have already grouped on a column in the Table view, Shipcountry, for example, you can select the option to chart OrderPrice by Shipcountry.
- In the Chart Setup window, select columns to draw the chart: To add the column for the x-axis, click the button next to the Data box.
Selecting the x-axis and y-axis will draw the chart. You can also process data in the Chart Setup: Set the following options to create the chart shown below.
- Calculate a total for the y-axis: Click the button next to the Data box for the y-axis and select Specify Calculation. Then select the SUM function and the column, Shipcountry, for example.
- Select a summary for the y-axis in the Summary menu.
- Customize the chart in the Axis Options section: Enable the option to 'Show data points on chart' or specify the label angle.

Data Connectors
ETL/ ELT Solutions
Cloud & API Connectivity
OEM & Custom Drivers