Discover how a bimodal integration strategy can address the major data management challenges facing your organization today.
Get the Report →Use Dash to Build to Web Apps on Dynamics NAV Data
Create Python applications that use pandas and Dash to build Dynamics NAV-connected web apps.
The rich ecosystem of Python modules lets you get to work quickly and integrate your systems more effectively. With the CData Python Connector for Dynamics NAV, the pandas module, and the Dash framework, you can build Dynamics NAV-connected web applications for Dynamics NAV data. This article shows how to connect to Dynamics NAV with the CData Connector and use pandas and Dash to build a simple web app for visualizing Dynamics NAV data.
With built-in, optimized data processing, the CData Python Connector offers unmatched performance for interacting with live Dynamics NAV data in Python. When you issue complex SQL queries from Dynamics NAV, the driver pushes supported SQL operations, like filters and aggregations, directly to Dynamics NAV and utilizes the embedded SQL engine to process unsupported operations client-side (often SQL functions and JOIN operations).
Connecting to Dynamics NAV Data
Connecting to Dynamics NAV data looks just like connecting to any relational data source. Create a connection string using the required connection properties. For this article, you will pass the connection string as a parameter to the create_engine function.
Before you can connect, OData Services will need to be enabled on the server. Once OData Services are enabled, you will be able to query any Services that are published on the server.
The User and Password properties, under the Authentication section, must be set to valid Dynamics NAV user credentials. In addition, you will need to specify a URL to a valid Dynamics NAV server organization root and a ServerInstance. If there is not a Service Default Company for the server, you will need to set the Company as well.
After installing the CData Dynamics NAV Connector, follow the procedure below to install the other required modules and start accessing Dynamics NAV through Python objects.
Install Required Modules
Use the pip utility to install the required modules and frameworks:
pip install pandas
pip install dash
pip install dash-daq
Visualize Dynamics NAV Data in Python
Once the required modules and frameworks are installed, we are ready to build our web app. Code snippets follow, but the full source code is available at the end of the article.
First, be sure to import the modules (including the CData Connector) with the following:
import os
import dash
import dash_core_components as dcc
import dash_html_components as html
import pandas as pd
import cdata.dynamicsnav as mod
import plotly.graph_objs as go
You can now connect with a connection string. Use the connect function for the CData Dynamics NAV Connector to create a connection for working with Dynamics NAV data.
cnxn = mod.connect("http://myserver:7048;User=myserver\Administrator;Password=admin;ServerInstance=DYNAMICSNAV71;")
Execute SQL to Dynamics NAV
Use the read_sql function from pandas to execute any SQL statement and store the result set in a DataFrame.
df = pd.read_sql("SELECT Name, Prices_Including_VAT FROM Customer WHERE Name = 'Bob'", cnxn)
Configure the Web App
With the query results stored in a DataFrame, we can begin configuring the web app, assigning a name, stylesheet, and title.
app_name = 'dash-dynamicsnavedataplot'

external_stylesheets = ['https://codepen.io/chriddyp/pen/bWLwgP.css']

app = dash.Dash(__name__, external_stylesheets=external_stylesheets)
app.title = 'CData + Dash'
Configure the Layout
The next step is to create a bar graph based on our Dynamics NAV data and configure the app layout.
trace = go.Bar(x=df.Name, y=df.Prices_Including_VAT, name='Name')

app.layout = html.Div(children=[html.H1("CData Extension + Dash", style={'textAlign': 'center'}),
	dcc.Graph(
		id='example-graph',
		figure={
			'data': [trace],
			'layout':
			go.Layout(title='Dynamics NAV Customer Data', barmode='stack')
		})
], className="container")
Set the App to Run
With the connection, app, and layout configured, we are ready to run the app. The last lines of Python code follow.
if __name__ == '__main__':
    app.run_server(debug=True)
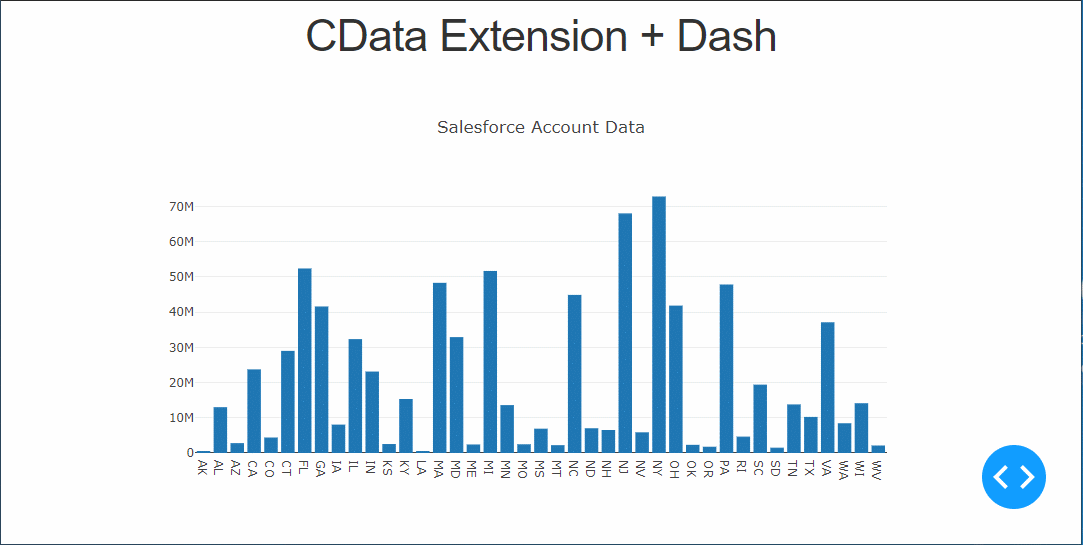
Now, use Python to run the web app and a browser to view the Dynamics NAV data.
python dynamicsnav-dash.py

Free Trial & More Information
Download a free, 30-day trial of the CData Python Connector for Dynamics NAV to start building Python apps with connectivity to Dynamics NAV data. Reach out to our Support Team if you have any questions.
Full Source Code
import os
import dash
import dash_core_components as dcc
import dash_html_components as html
import pandas as pd
import cdata.dynamicsnav as mod
import plotly.graph_objs as go

cnxn = mod.connect("http://myserver:7048;User=myserver\Administrator;Password=admin;ServerInstance=DYNAMICSNAV71;")

df = pd.read_sql("SELECT Name, Prices_Including_VAT FROM Customer WHERE Name = 'Bob'", cnxn)
app_name = 'dash-dynamicsnavdataplot'

external_stylesheets = ['https://codepen.io/chriddyp/pen/bWLwgP.css']

app = dash.Dash(__name__, external_stylesheets=external_stylesheets)
app.title = 'CData + Dash'
trace = go.Bar(x=df.Name, y=df.Prices_Including_VAT, name='Name')

app.layout = html.Div(children=[html.H1("CData Extension + Dash", style={'textAlign': 'center'}),
	dcc.Graph(
		id='example-graph',
		figure={
			'data': [trace],
			'layout':
			go.Layout(title='Dynamics NAV Customer Data', barmode='stack')
		})
], className="container")

if __name__ == '__main__':
    app.run_server(debug=True)


