Discover how a bimodal integration strategy can address the major data management challenges facing your organization today.
Get the Report →Import and Visualize Drip Data in Power View
Create data visualizations based on Drip data in Excel.
You can use the built-in ODBC support in Excel to rapidly create Power View reports featuring Drip data. This article shows how to use the Data Connection Wizard, accessible from the Data ribbon, to import Drip data into a Power View report.
Connect to Drip as an ODBC Data Source
If you have not already, first specify connection properties in an ODBC DSN (data source name). This is the last step of the driver installation. You can use the Microsoft ODBC Data Source Administrator to create and configure ODBC DSNs.
Start by setting the Profile connection property to the location of the Drip Profile on disk (e.g. C:\profiles\Drip.apip). Next, set the ProfileSettings connection property to the connection string for Drip (see below).
Drip API Profile Settings
To use Token Authentication, specify your APIKey within the ProfileSettings connection property. The APIKey should be set to your Drip personal API Token.
When you configure the DSN, you may also want to set the Max Rows connection property. This will limit the number of rows returned, which is especially helpful for improving performance when designing reports and visualizations.
Connect with the Data Connection Wizard
Follow the steps below to connect to the DSN from the Data Connection Wizard in Excel.
- On the Data tab, click From Other Sources -> From Data Connection Wizard.
- In the Data Connection Wizard, select the ODBC DSN option.
- Select the ODBC DSN for Drip from the list.
Select the tables you want to work with.
If you want to import multiple tables, deselect the "Connect to a specific table" option. After you connect to the data source, you can select multiple tables: After you click Finish to close the Data Connection Wizard, select the "Enable selection of multiple tables" option in the Select Table dialog.
- In the Import Data dialog, select the destination for your data. For example, select the Table option and the Existing worksheet option. Then click the cell in your worksheet where results should be output.
- Click Insert -> Power View to create a new Power View report.
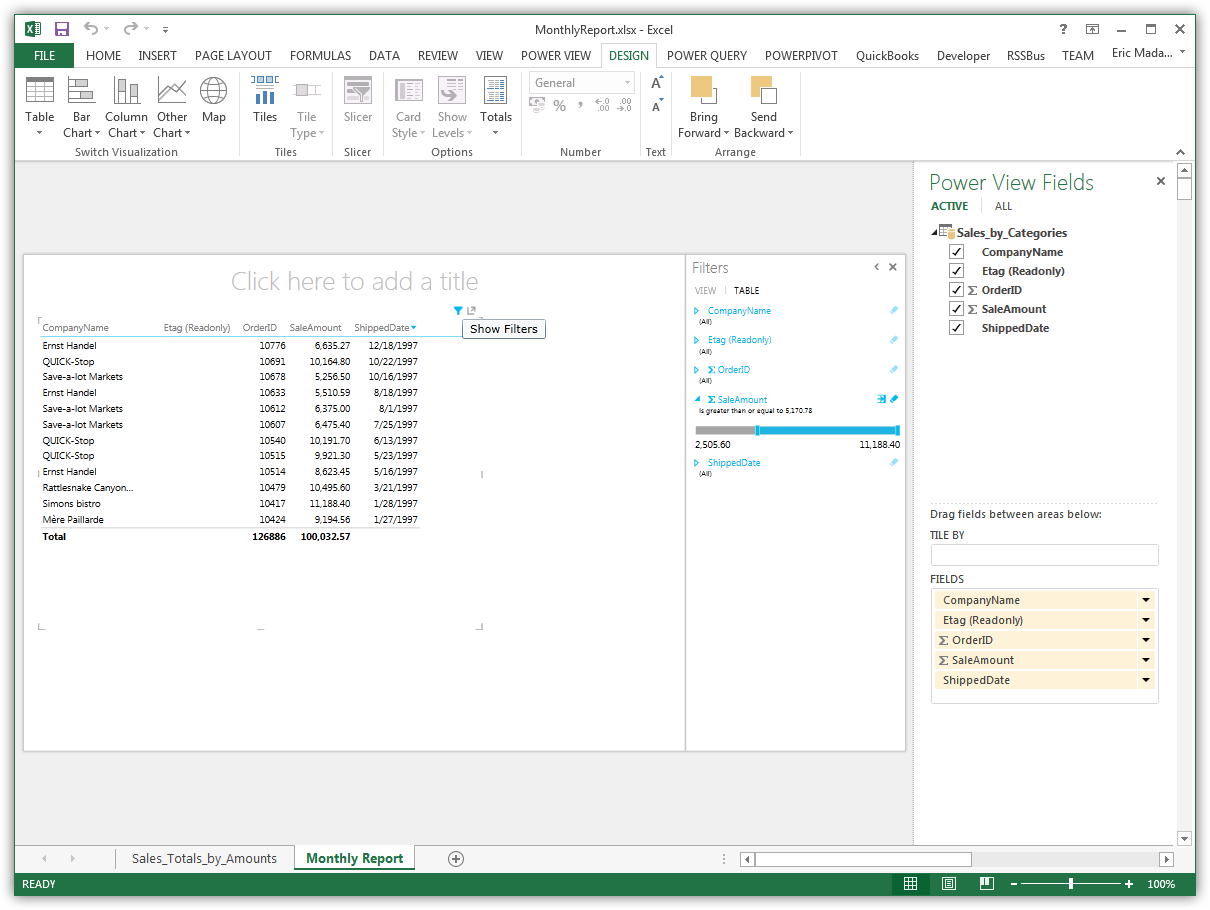
Create a Table
Tables are the starting point for charts and other representations of your data. To create a table, select a column in the field list. You can also drag and drop table names and column names onto the view.

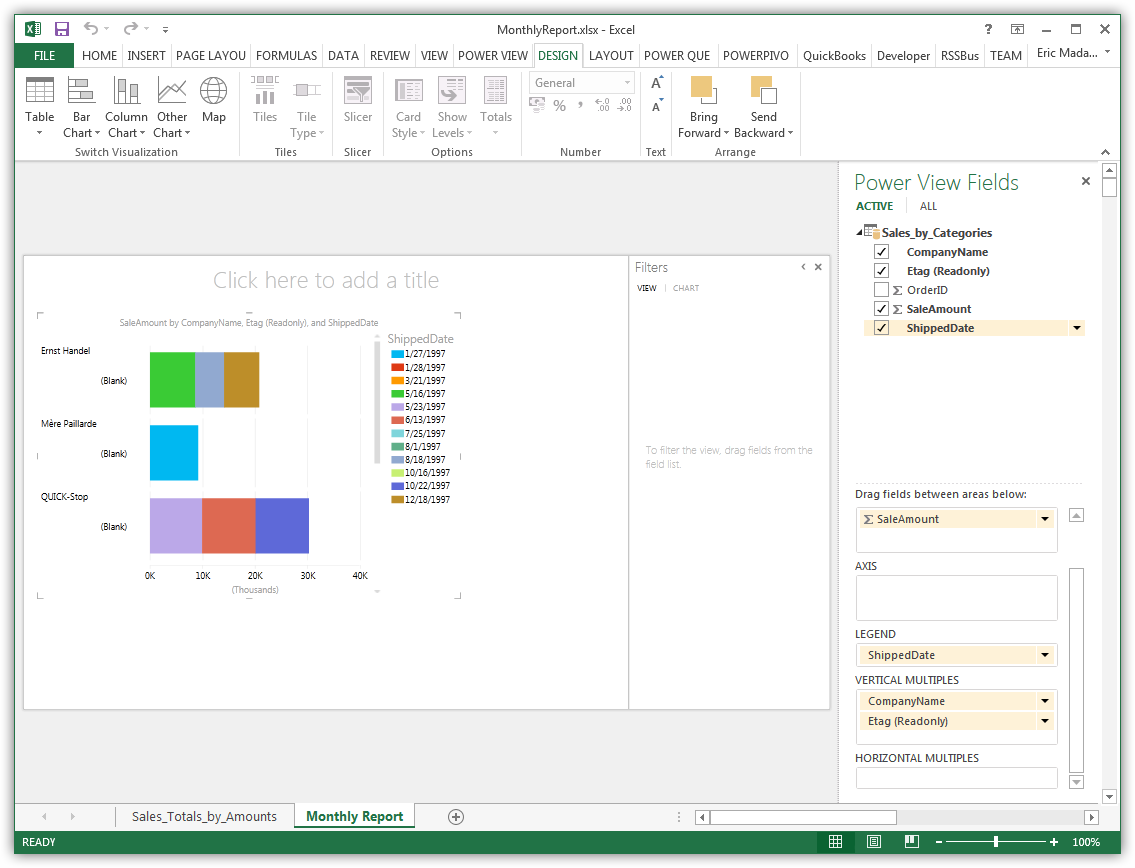
Create Data Visualizations
On the Design tab, you can change tables into charts and other visualizations.


