Discover how a bimodal integration strategy can address the major data management challenges facing your organization today.
Get the Report →How to Connect the Power BI Service to BigQuery: Complete Guide
Connect to the CData Power BI Connectors from PowerBI.com to provide real-time datasets across the organization.
The CData Power BI Connector for BigQuery seamlessly integrates with the tools and wizards in Power BI, including the real-time data workflows on PowerBI.com. Follow the steps below to publish reports to PowerBI.com and use the Power BI Gateway to configure automatic refresh.
About BigQuery Data Integration
CData simplifies access and integration of live Google BigQuery data. Our customers leverage CData connectivity to:
- Simplify access to BigQuery with broad out-of-the-box support for authentication schemes, including OAuth, OAuth JWT, and GCP Instance.
- Enhance data workflows with Bi-directional data access between BigQuery and other applications.
- Perform key BigQuery actions like starting, retrieving, and canceling jobs; deleting tables; or insert job loads through SQL stored procedures.
Most CData customers are using Google BigQuery as their data warehouse and so use CData solutions to migrate business data from separate sources into BigQuery for comprehensive analytics. Other customers use our connectivity to analyze and report on their Google BigQuery data, with many customers using both solutions.
For more details on how CData enhances your Google BigQuery experience, check out our blog post: https://www.cdata.com/blog/what-is-bigquery
Getting Started
1. Create a DSN
Installing the Power BI Connector creates a DSN (data source name) called CData Power BI BigQuery. This the name of the DSN that Power BI uses to request a connection to the data source. Configure the DSN by filling in the required connection properties.
You can use the Microsoft ODBC Data Source Administrator to create a new DSN or configure (and rename) an existing DSN: From the Start menu, enter "ODBC Data Sources." Ensure that you run the version of the ODBC Administrator that corresponds to the bitness of your Power BI Desktop installation (32-bit or 64-bit).
Google uses the OAuth authentication standard. To access Google APIs on behalf of individual users, you can use the embedded credentials or you can register your own OAuth app.
OAuth also enables you to use a service account to connect on behalf of users in a Google Apps domain. To authenticate with a service account, you will need to register an application to obtain the OAuth JWT values.
In addition to the OAuth values, you will need to specify the DatasetId and ProjectId. See the "Getting Started" chapter of the help documentation for a guide to using OAuth.
2. Get BigQuery Data
With the data source configured, follow the steps below to load data from BigQuery tables into a dataset.
Select Tables and Views to Load
- Open Power BI Desktop and click Get Data -> CData BigQuery.
- Select CData Power BI BigQuery in the Data Source Name menu and select the Import data connectivity mode.
- Expand the CData Power BI BigQuery folder, expand an associated schema folder, and select tables.
![The available tables. (Salesforce is shown.)]()
Shaping Data
Use the Query Editor if you need more control over the query and query results before you load the data. Power BI detects the column behavior from the BigQuery metadata retrieved by the CData connector. In the Query Editor, you can perform actions like filtering, summarizing, and sorting on columns.
To open the Query Editor, click Edit in the Navigator window. Right-click a row to filter the rows. Right-click a column header to perform actions like the following:
- Change column data types
- Remove a column
- Group by columns
Power BI records your query modifications in the Applied Steps section, adjusting the underlying data retrieval query that is executed to the remote BigQuery data.
Load Data
When you click Load, the connector executes the underlying query to BigQuery.
3. Create Data Visualizations
After loading BigQuery data into Power BI, you can create data visualizations in the Report view by dragging fields from the Fields pane onto the canvas. Follow the steps below to create a pie chart:
- Select the pie chart icon in the Visualizations pane.
- Select a dimension in the Fields pane: for example, OrderName.
- Select a measure in the Fields pane: for example, Freight.
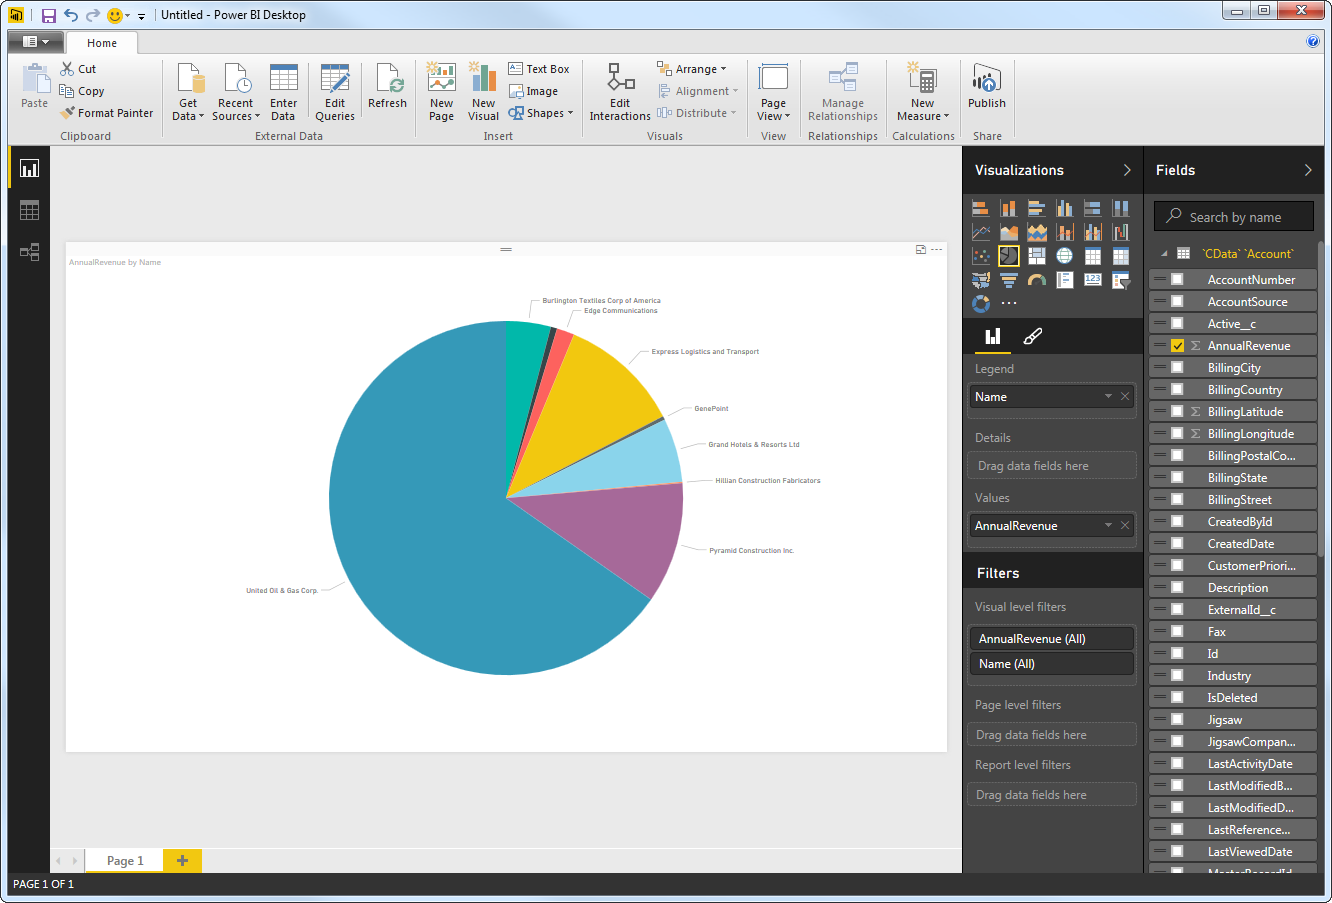
You can change sort options by clicking the ellipsis (...) button for the chart. Options to select the sort column and change the sort order are displayed.
You can use both highlighting and filtering to focus on data. Filtering removes unfocused data from visualizations; highlighting dims unfocused data. You can highlight fields by clicking them:
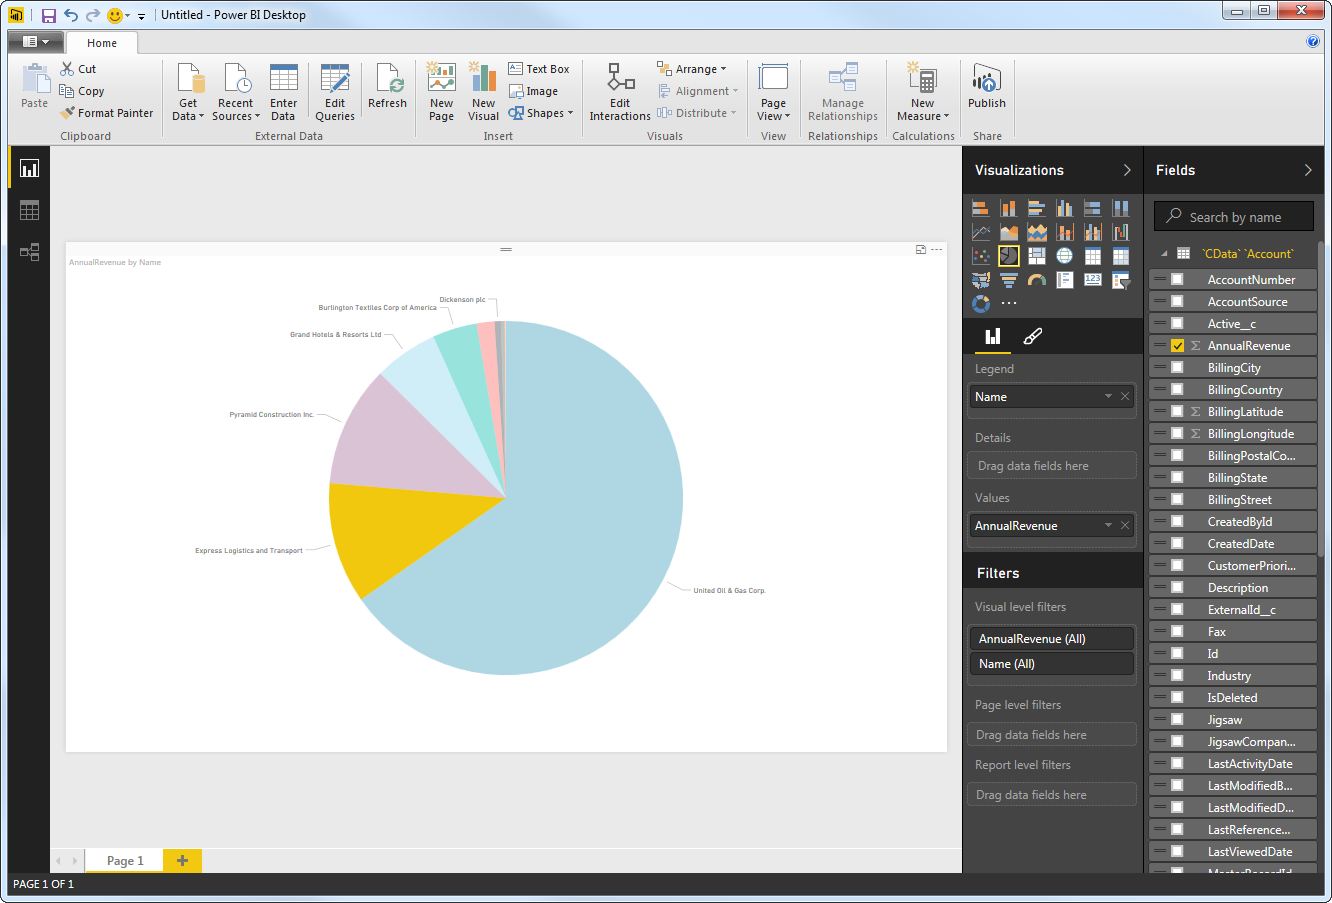
You can apply filters at the page level, at the report level, or to a single visualization by dragging fields onto the Filters pane. To filter on the field value, select one of the values that are displayed in the Filters pane.
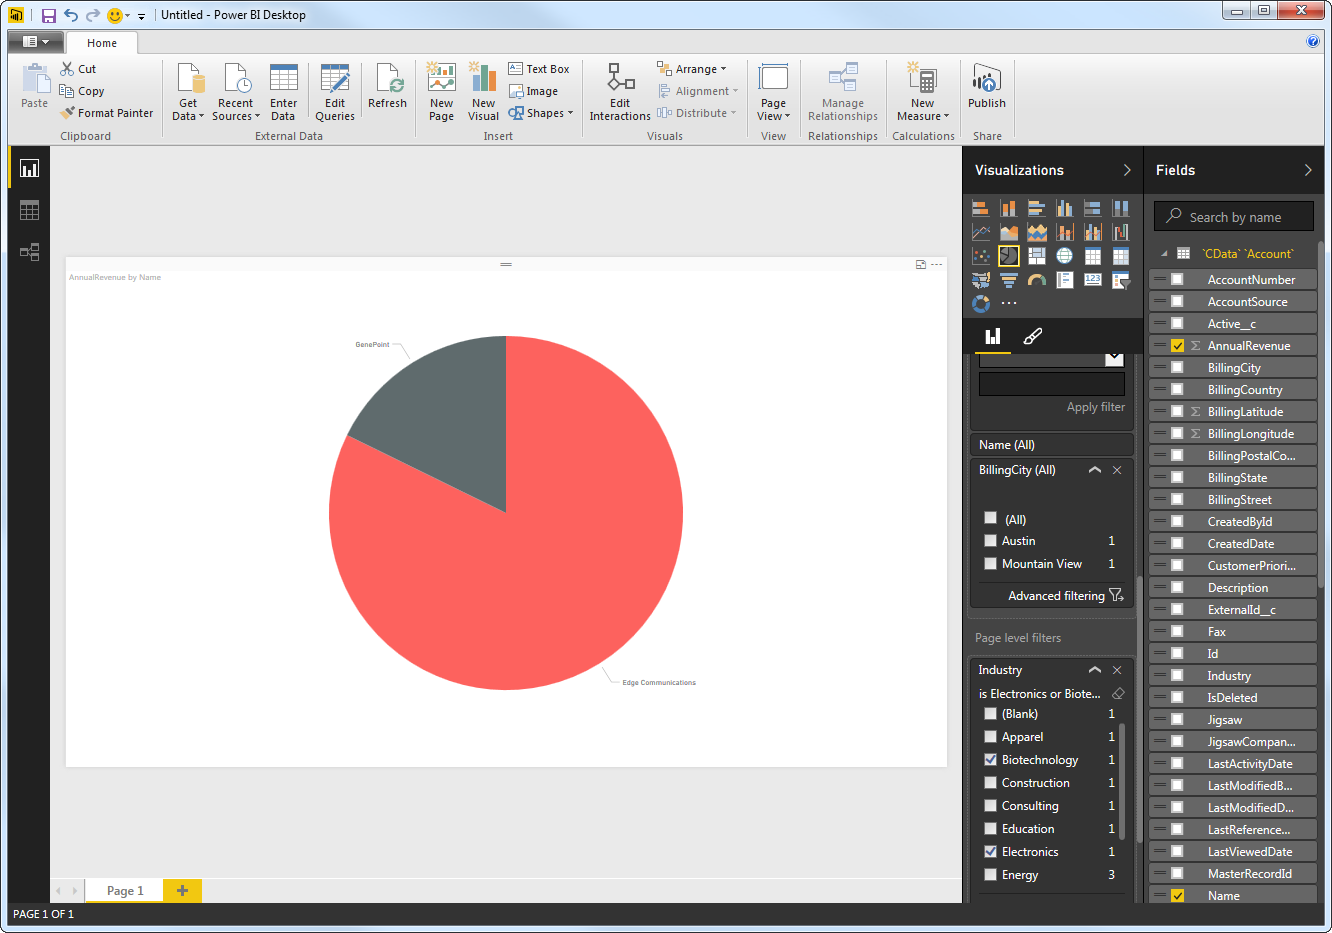
Click Refresh to synchronize your report with any changes to the data.
4. Configure Data Refresh on PowerBI.com
Follow the steps below to configure automatic data refresh through the Power BI Gateway. The gateway enables the Power BI cloud service to connect to the DSN on your machine.
Selecting a Gateway Mode
You need to select a gateway mode when you install the gateway:
- Gateway (personal mode): Use the gateway in personal mode if you only need to publish to PowerBI.com and refresh reports. The gateway runs under your Windows user account.
- (Recommended) Gateway (Standard mode - formerly Enterprise): Use the gateway in standard mode if you are using other Azure services that require a gateway. You also need the default gateway if multiple users need to access the gateway.
You need a system DSN to connect through the default gateway. (System DSNs can be accessed system-wide, while user DSNs can only be used by a specific user account.) You can use the CData Power BI GoogleBigQuery system DSN configured as the last step of the connector installation.
Configuring the Gateway (Personal Mode)
Publishing through the gateway in personal mode simply requires an installed gateway with access to custom connectors.
- Run the CData Power BI Connector installer. If you have not already done so, download the Power BI Gateway.
- Select the on-premises data gateway (personal mode) option.
- Sign into the gateway.
- Name the gateway and specify a recovery key.
- In the Connectors section of the gateway settings, enable the custom data connectors option. You can also specify an alternate path to the custom data connector .pqx files here.
Note: The CData Power BI Connectors install the .pqx files to the default folder, Your User Home\Documents\Power BI Desktop\Custom Connectors.
Configuring the Gateway (Standard Mode)
Publishing through the gateway requires an installed gateway with access to customer connectors and a configured connection to the DSN for BigQuery from PowerBI.com
1. Set Up the Gateway
Follow the steps below to configure the gateway on your machine:
- Run the CData Power BI Connector installer. If you have not already done so, download the Power BI Gateway.
- Select the on-premises data gateway (recommended) option.
- Sign into the gateway.
- Name the gateway and specify a recovery key.
In the Connectors step, choose a folder where the gateway will look for the CData Power BI Connector. This article uses C:\Users\PBIEgwService\Documents\Power BI Desktop\Custom Connectors\. Copy the .pqx files for the CData Connector (found in C:\Users\USERNAME\Documents\Power BI Desktop\Custom Connectors\) to the folder you configured.
NOTE: The account configured for the service (NT SERVICE\PBIEgwService) needs to be able to access the folder chosen for the gateway. If needed, you can change the service account in the Service Settings section of the gateway installer.
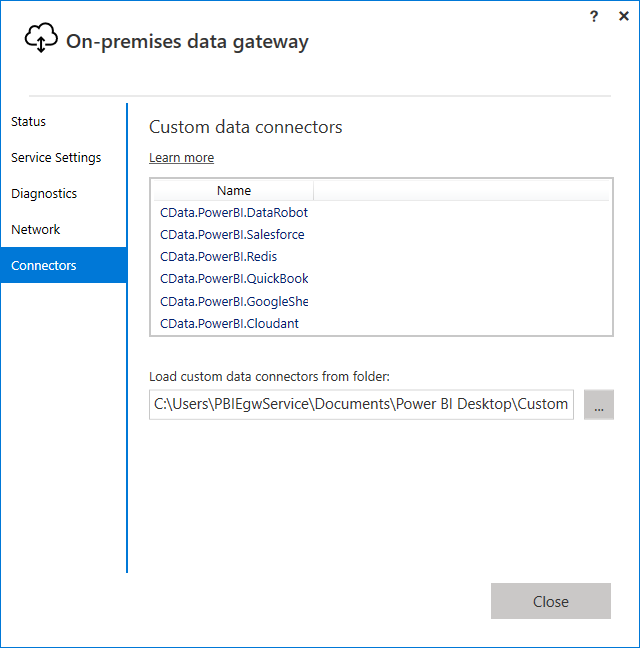
- Confirm that the entry CData.PowerBI.GoogleBigQuery is displayed in the list in the Connectors section.
![CData Power BI Connectors in the On-Premises Data Gateway.]()
2. Connect to BigQuery Data from PowerBI.com
- Add a data source to the gateway: Log into PowerBI.com and from the Settings menu, select Manage Gateways and select your gateway.
- Select the option to "Allow user's custom data connectors to refresh through this gateway cluster."
- Click Apply to save your changes.
- Click the option to add a data source to the gateway.
- In the Data Source Settings section, enter a name for the data source and in the Data Source Type menu select CData Power BI Connector for BigQuery.
- In the Data Source Name box that is displayed, enter the system DSN: CData Power BI GoogleBigQuery.
5. Publish to PowerBI.com
You can now publish refreshable reports and their underlying datasets. Follow the steps below to publish and complete the data refresh configuration for a dataset.
- In Power BI Desktop, click Publish on the Home ribbon to publish the report.
- On PowerBI.com, select the workspace where you uploaded the report.
- In the Datasets section, click the options menu for the BigQuery dataset you created, then click Settings.
- In the Gateway Connection section, enable the option to use a gateway and select your gateway. You may need to manually add the data source to the gateway:
- Expand the Gateway under the Actions column
- Click the link to "Manually add to gateway"
![Manually adding a data source to the gateway.]()
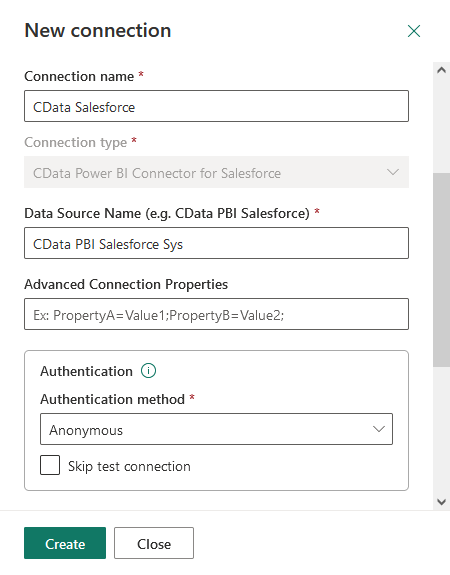
- In the "New connection" form, set the Connection name, set Data Source Name to the same data source name as above (e.g. "CData PBI BigQuery"), and set Authentication Method to "Anonymous"
![Configuring the connection for the gateway.]()
- Set Privacy Level as needed and click "Create"
- If you are using the gateway in personal mode, expand the Data Source Credentials node and click Edit Credentials -> Sign In. (This step is not necessary if you are using the default gateway.)
6. Refresh a Dataset
Refresh the dataset to provide the current data to your reports.
- To refresh manually, open the dataset options menu from your workspace -> Datasets and click Refresh Now.
- To schedule refreshes, open the dataset options menu from your workspace -> Datasets and click Schedule Refresh. Enable the option to keep your data up to date. Specify the refresh frequency in the menus.
- In Report view, click Refresh to sync the report with the dataset as you work.


