Discover how a bimodal integration strategy can address the major data management challenges facing your organization today.
Get the Report →Import and Visualize BigQuery Data in Power View
Create data visualizations based on BigQuery data in Excel.
You can use the built-in ODBC support in Excel to rapidly create Power View reports featuring BigQuery data. This article shows how to use the Data Connection Wizard, accessible from the Data ribbon, to import BigQuery data into a Power View report.
Connect to BigQuery as an ODBC Data Source
If you have not already, first specify connection properties in an ODBC DSN (data source name). This is the last step of the driver installation. You can use the Microsoft ODBC Data Source Administrator to create and configure ODBC DSNs.
Google uses the OAuth authentication standard. To access Google APIs on behalf of individual users, you can use the embedded credentials or you can register your own OAuth app.
OAuth also enables you to use a service account to connect on behalf of users in a Google Apps domain. To authenticate with a service account, you will need to register an application to obtain the OAuth JWT values.
In addition to the OAuth values, you will need to specify the DatasetId and ProjectId. See the "Getting Started" chapter of the help documentation for a guide to using OAuth.
When you configure the DSN, you may also want to set the Max Rows connection property. This will limit the number of rows returned, which is especially helpful for improving performance when designing reports and visualizations.
About BigQuery Data Integration
CData simplifies access and integration of live Google BigQuery data. Our customers leverage CData connectivity to:
- Simplify access to BigQuery with broad out-of-the-box support for authentication schemes, including OAuth, OAuth JWT, and GCP Instance.
- Enhance data workflows with Bi-directional data access between BigQuery and other applications.
- Perform key BigQuery actions like starting, retrieving, and canceling jobs; deleting tables; or insert job loads through SQL stored procedures.
Most CData customers are using Google BigQuery as their data warehouse and so use CData solutions to migrate business data from separate sources into BigQuery for comprehensive analytics. Other customers use our connectivity to analyze and report on their Google BigQuery data, with many customers using both solutions.
For more details on how CData enhances your Google BigQuery experience, check out our blog post: https://www.cdata.com/blog/what-is-bigquery
Getting Started
Connect with the Data Connection Wizard
Follow the steps below to connect to the DSN from the Data Connection Wizard in Excel.
- On the Data tab, click From Other Sources -> From Data Connection Wizard.
- In the Data Connection Wizard, select the ODBC DSN option.
- Select the ODBC DSN for BigQuery from the list.
Select the tables you want to work with.
If you want to import multiple tables, deselect the "Connect to a specific table" option. After you connect to the data source, you can select multiple tables: After you click Finish to close the Data Connection Wizard, select the "Enable selection of multiple tables" option in the Select Table dialog.
- In the Import Data dialog, select the destination for your data. For example, select the Table option and the Existing worksheet option. Then click the cell in your worksheet where results should be output.
- Click Insert -> Power View to create a new Power View report.
Create a Table
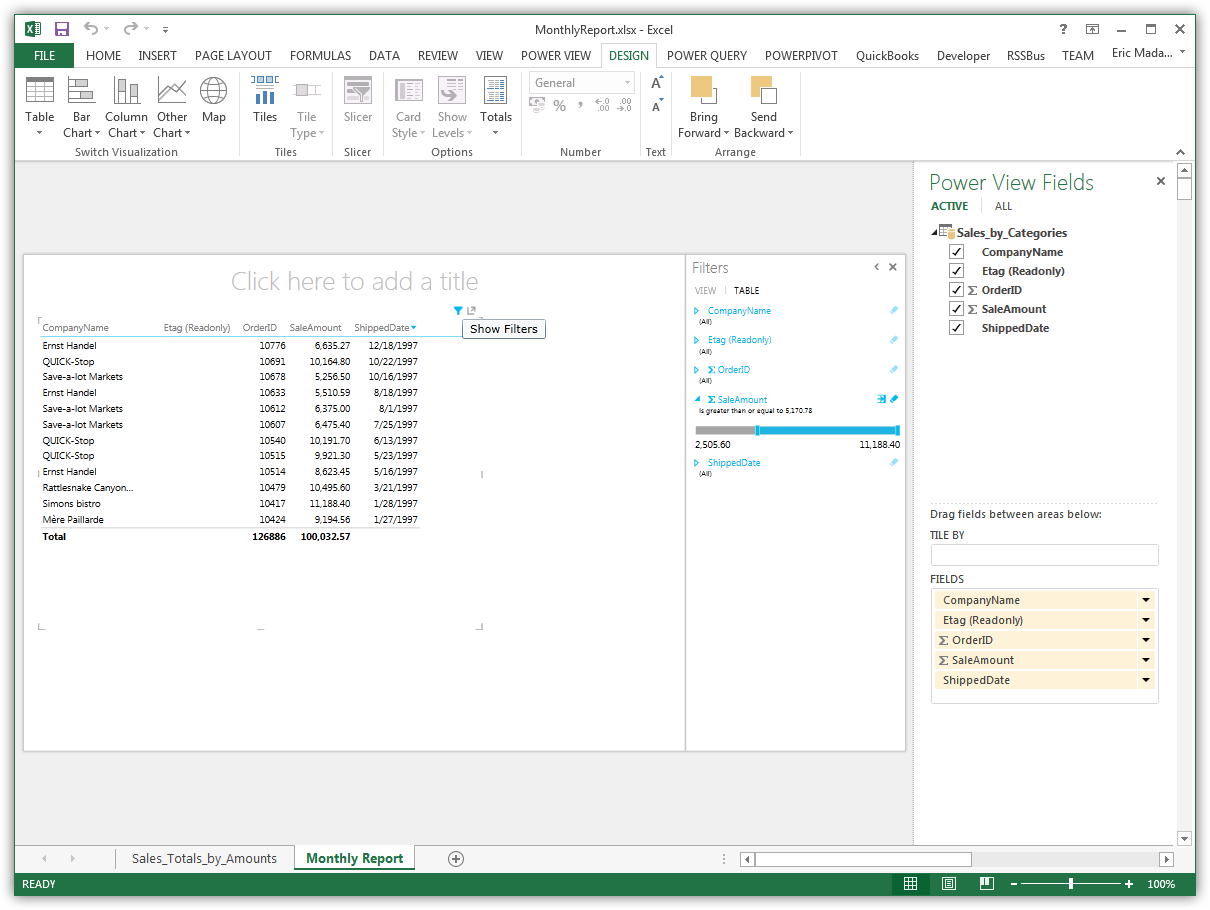
Tables are the starting point for charts and other representations of your data. To create a table, select a column in the field list. You can also drag and drop table names and column names onto the view.

Create Data Visualizations
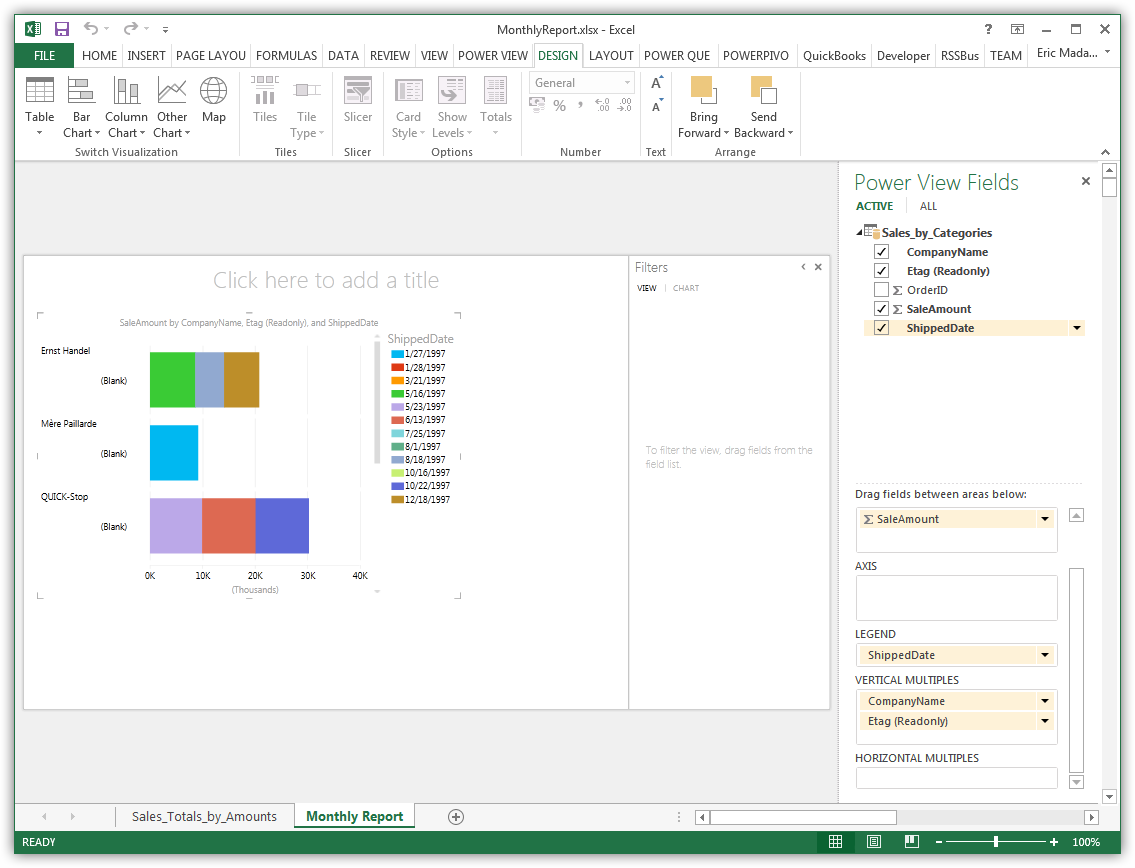
On the Design tab, you can change tables into charts and other visualizations.


